Here we start to actually use snestistics.
Running snes9x
The first step to obtain the disassembly is to use the special version of snes9x that has been patched to output a snestistics .trace file. Note that this only work under Windows for now.
First start our version of snes9x (snes9x-snestistics.exe). Note the Snestistics menu right next to the help menu.
Now we load the Battle Pinball ROM and let the game start. Here is an image from the intro:

Now when we are satisfied we select Snestistics->Save trace and exit…:
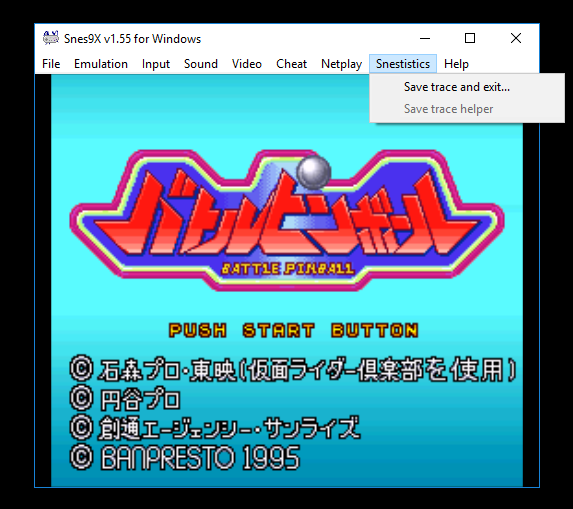
The trace can now be found in the Roms directory and it is named trace0.trace. If you loaded many games or reset the game there will be multiple trace files (trace1.trace etc).
Note that trace files currently end up in the current working directory so if you start a movie playback in snes9x the traces will end up in the directory of the movie instead. This will probably be fixed in a future version of snes9x-snestistics. Every time the emulator is reset (loading movie, loading new ROM) the previous trace file will be closed and a new one will be opened, named trace1.trace etc.
The Save trace helper option enabled saving of an additional file named .trace_helper. It can be currently be very big but it will help the emulator know if it has meesed up. If recommend you to use it once when starting up with a new game to make sure the emulator supports all the features of the game. Then it can be turned off. If you want to submit a bug the .trace and the .trace_helper file are both needed. We also highly recommend that you use a snes9x movie (.SMV) that contains your play session. That way you can recreate the .trace-file whenever the file format of the .trace-file changes. Yes we are planning a change of this format!!! If you record a movie the .trace-file will end up in the directory where the .SMV-file is located.
Running snestistics
Once you have your trace file you are ready to generate the assembler source. We assume that you are running snestistics from a shell such as bash or cmd.exe and that you’ve gotten snestistics pre-built for your platform somehow. The minimal command line parameters to generate assembler output are (put them on one line, newlines here to make it easier to read!)
snestistics
  -romfile battle_pinball.sfc
  -tracefile trace0.trace
  -asmoutfile pinball.asm
  -reportoutfile pinball_report.txt
This assumes that your working directory is where you’ve placed battle_pinball.sfc and trace0.trace. The outputs will be pinball.asm and pinball_report.txt. There might be other output files (depending on settings for our snes9x variant) but they can be ignored. There are many more options available. See the command line reference in the user guide. But let’s concentrate on these for today!
It is very important to note here that some games will work flawlessly out of the box while some will simply cause an error here (or even a crash). If you want to work on a game and you encounter issues here, don’t hesitate to contact us and we will fix the issue. There are some known limitations discussed in the snestistics readme.
Since we re-emulate the CPU portion of the game session and our emulator is not very fast this can take quite some time, but the result is cached so all future runs will be fast. It should be noted that there will a .emulation_cache-file created next to the trace file that contains this cached data. If it is deleted (or deemed invalid due to updated .trace-file or updated .emulation_cache-version) it will automatically regenerated.
The assembler source
What is in the source code?
Snestistics only knows about operations that were executed during the emulation sessions done previously in snes9x. So unless the tracefile(s) cover 100% of the game’s code there will be gaps in the disassembly. This can be a good thing or a bad thing; if you only recorded the first second of the game and the created the trace file then only instructions used during the first second will be included.
OK, enough about that. Let’s look at some random source code to see what it looks like!
A line of code
First let’s look at few lines:
label_8083DF:
    /* mI 80      8083DF E2 20       */ sep.b #$20

label_8083E1:
    /* mI 80      8083E1 AD 12 42    */ lda.w REG_FLAGS                 ; H/V Blank Flags and Joypad Status - [DB=80]
    /* mI 80      8083E4 29 01       */ and.b #$01
    /* mI 80      8083E6 D0 F9       */ bne.b label_8083E1
    /* mI 80      8083E8 E2 10       */ sep.b #$10
    /* mi 80      8083EA A0 02       */ ldy.b #$02
    /* mi 80      8083EC C2 20       */ rep.b #$20
    /* Mi 80      8083EE A2 00       */ ldx.b #$00

label_8083F0:
    /* Mi 80      8083F0 BD CA 02    */ lda.w $02CA,x                   ; 7E02CA [DB=80 X=0, 2]
    /* Mi 80      8083F3 9D D4 02    */ sta.w $02D4,x                   ; 7E02D4 [DB=80 X=0, 2]
    /* Mi 80      8083F6 BD 18 42    */ lda.w $4218,x                   ; REG_JOY1L Controller Port Data Registers (Pad 1 - Low) - [DB=80 X=0, 2]
    /* Mi 80      8083F9 9D CA 02    */ sta.w $02CA,x                   ; 7E02CA [DB=80 X=0, 2]
    /* Mi 80      8083FC 5D D4 02    */ eor.w $02D4,x                   ; 7E02D4 [DB=80 X=0, 2]
    /* Mi 80      8083FF 3D CA 02    */ and.w $02CA,x                   ; 7E02CA [DB=80 X=0, 2]
    /* Mi 80      808402 9D DE 02    */ sta.w $02DE,x                   ; 7E02DE [DB=80 X=0, 2]
    /* Mi 80      808405 E8          */ inx
    /* Mi 80      808406 E8          */ inx
    /* Mi 80      808407 88          */ dey
    /* Mi 80      808408 D0 E6       */ bne.b label_8083F0
    /* Mi 80      80840A 60          */ rts
First we have a label called label_8083DF. The number after the word label shows the program counter needed to execute this code. In this case the snippets starts at offset $83FD in bank $80 (the $ here simply means that the number is written in hexadecimal form).
Then if we look at a line in the code we have:
/* mi 80 8083EC C2 20 */ rep.b #$20
What does each piece mean?
- The lower-case m indicates that we have a 8-bit accumulator (memory flag is set). If multiple values a * will be there instead.
- The upper-case I indicates that we have 16-bit index registers (index flag is not set). If multiple values a * will be there instead.
- The 80 means that the data bank was $80 for this instruction. If there was many options this field will simply be white spaces.
- The column with four white spaces after 80 is room for the direct page. Since this piece of code doesn’t care about the direct page register it seems to be called with all sorts of values and hence it is left blank.
- The 8083DF means that this instruction is used when the program bank and program counter is $8083DF (bank $80, address $83DF).
- C2 20 is the encoding of this opcode as bytes. This is what can be found in the ROM-file.
- rep.B #$20 means that we clear the processor status flags for the flags in the number $20.
- Note how on the next line the accumulator is now 16-bit (upper-case M).
- We will not teach 65816 assembly here!
- Bonus: In this case we are in bank $80 which is a mirror of bank $00. This means that Battle Pinball is using FastROM.
The indicators in the comment are not perfect. They reflect the values encountered during our emulated session in snes9x. Maybe in a longer session this code will be called in other ways. If there is an uncertainty a star will be printed instead indicating that there was multiple choices.
While we have no idea how this code snippet is used, with some SNES experience it can already be deduced that it reads MMIO-mapped joypad inputs (from $4218,x) and stores the currently pressed button bitmask in RAM at $02CA,x as well as a bitmask for the buttons trigged since the last readout at $02DE,x. In the comment you can see the word joypad in two places so you don’t have to know all MMIO-mapped stuff by heart!
Labels for jumps
In our code snippet we have a jump in the form of a branch.
/* Mi 80 808408 D0 E6 */ bne.b label_8083F0
It is very convenient that we get the label name. That makes it easy to search for it in the assembly source.
Labels for indirect jumps
Some jumps are data-driven. That means that they get an address from somewhere (RAM or ROM) and then jumps to that address. Since that address might not be part of the ROM it may be hard to know the value by just looking at the source code. In snestistics all indirect jump locations appear as a comment.
label_80E412:
    /* mI 80 0900 80E412 C2 30       */ rep.b #$30
    /* MI 80 0900 80E414 A5 70       */ lda.b $70                       ; 7E0970 [DP=900]
    /* MI 80 0900 80E416 29 7F 00    */ and.w #$007F
    /* MI 80 0900 80E419 0A          */ asl A
    /* MI 80 0900 80E41A AA          */ tax
    /* MI 80 0900 80E41B 7C 1E E4    */ jmp.w ($E41E,x)
          ; label_80E43C [X=0000]
          ; label_80E460 [X=0002]
          ; label_80E461 [X=0004]
          ; label_80E63E [X=0018]
We can see that in this unknown code starting at label_80E744 there is a jump to the indirect address located in ROM location $80E750 plus the X register. Instead of needing to look up those pointers in a hex editor, snestistics outputs a list of all addresses jumped to in our emulated session. We can also not that there are data after this functions which does seem to be the jump table that is being used.
Where does the program “start”?
Lets look at the top of the generated assembly file in the Headers section:
.SNESNATIVEVECTOR      ; Define Native Mode interrupt vector table
  COP    $81B1
  BRK    $81B1
  ABORT  $81B1
  NMI    label_0081B8
  IRQ    $8192
.ENDNATIVEVECTOR

.SNESEMUVECTOR         ; Define Emulation Mode interrupt vector table
  COP    $81B1
  ABORT  $81B1
  NMI    $81B1
  RESET  label_008000
  IRQBRK $81B1
.ENDEMUVECTOR
What does this tell us? Well we can see that the game starts execution in label_008000 and that whenever a NMI is generated label_0081B8 will be called. There is probably an empty handler at $81B1 but since it was never invoked there is no label in our code and thus hexadecimal addresses are generated here instead of label name.
If we look in the code we see:
; Vector: Emulation RESET
label_008000:
    /* mi 00 0000 008000 78          */ sei
    /* mi 00 0000 008001 C2 09       */ rep.b #$09
    /* mi 00 0000 008003 FB          */ xce
    /* mi 00 0000 008004 5C 08 80 80 */ jmp.l label_808008
and
; Vector: Native NMI
label_0081B8:
    /* **         0081B8 5C BC 81 80 */ jmp.l label_8081BC
These two comments are automatically added. They signal that these labels is special somehow. We see that both jump to bank 80 to enable the fast ROM mode.
Bonus
If we look at the line
/* Mi 80 8083F0 BD CA 02 */ lda.w $02CA,x ; 7E02CA [DB=80 X=0, 2]
we see that there are some extra stuff in the comment. It gives more information. In this case it says that this particular operation was executed with X=0 and X=2 with DB (data bank) $80. The number 7E02CA simply indicates that the base pointer is mapped to bank $7E where some of the RAM-memory is located. This is mostly to remind about how this variant of the op is working. If there had been more values of X it could look like this:
/* MI 808623 9F 00 22 7E */ sta.l $7E2200,x ; 7E2200 [X=<0, 4, ..., 200>]
Here we can see that this line were run with X=0, X=4, X=8, X=12 and so on until X=200. The <> symbols indicate that we are dealing with a range. The difference between all the values in the range is the same. It can be deduced from the two first numbers.
This feature is powerful if you want to know what values of X, Y, DB or DP were used for this particular instruction. If the operation used indirect addressing the indirect base pointer will be written in the comment. If it is in ROM memory you might just have found an important table!
Formatting
There are many command line switches to toggle things on/off. They can be nice if you want a more clean source code or if you need more information only sometimes. Regenerating the source code is very fast (supposed to be faster than one second) so it is fast to switch or generated multiple versions with different output names. See the command line reference in the user guide.
Can the assembly source code be compiled?
The short story is that the source code is almost WLA-DX compatible and provided a correct header (something that can be given to snestistics using -asmheaderfile) it can almost be compiled OVER the ROM without causing a diff. It can’t recreate the full ROM since data and code that is not executed is not part of the assembly source. A future post will revisit this topic and it will also discuss limitations.
Closing words
That was all! It might seem clunky with raw assembler source code now that we live in the future but we promise that once you get it into a proper text editor (such as Sublime Text, which we use) it is very easy to jump around and search for label names and other things of interest.
In the next post we will look at how you can start annotating the source code once you start to discover what things do.